UPSC Indian Statistical Service (ISS) MCQs
Prepare for the UPSC Indian Statistical Service (ISS) exam with a comprehensive collection of multiple-choice questions (MCQs). These MCQs cover crucial topics such as Statistics, General Studies, and Data Interpretation, aligned with the actual exam pattern. Practicing these questions will help aspirants improve their analytical skills, boost problem-solving abilities, and enhance time management for the exam. Whether you're revising key concepts or testing your knowledge, these ISS MCQs are an invaluable resource for cracking the UPSC Indian Statistical Service exam and securing a prestigious role in India’s statistical agencies.
Q1. What is the mean of the data set: 2, 4, 6, 8, 10?
📘 View ExplanationQ2. The variance of a data set measures:
📘 View ExplanationQ3. The probability of an impossible event is:
📘 View ExplanationQ4. Which distribution is called the "bell curve"?
📘 View ExplanationQ5. Central Limit Theorem describes:
📘 View ExplanationQ6. Which method is used for estimating population parameters from a sample?
📘 View ExplanationQ7. If P(A) = 0.3 and P(B) = 0.4, and events A and B are mutually exclusive, what is P(A or B)?
📘 View ExplanationQ8. The median is:
📘 View ExplanationQ9. Which test is used to check independence between two categorical variables?
📘 View ExplanationQ10. The null hypothesis in statistical testing is:
📘 View ExplanationQ11. In regression analysis, the dependent variable is:
📘 View ExplanationQ12. Which scale of measurement uses categories without order?
📘 View ExplanationQ13. The purpose of hypothesis testing is to:
📘 View ExplanationQ14. In probability, “independent events” mean:
📘 View ExplanationQ15. Which graphical representation is best for showing distribution of a quantitative variable?
📘 View ExplanationQ16. Time series analysis is used to:
📘 View ExplanationQ17. Which of the following is a measure of central tendency?
📘 View ExplanationQ18. “Sampling error” refers to:
📘 View ExplanationQ19. Which is a non-parametric test?
📘 View ExplanationQ20. The term “multicollinearity” is associated with:
📘 View ExplanationQ21. Which distribution is used to model number of successes in fixed number of independent Bernoulli trials?
📘 View ExplanationQ22. Which test is used to compare means of two independent samples?
📘 View ExplanationQ23. What is the full form of “ANOVA”?
📘 View ExplanationQ24. Which of these is a measure of dispersion?
📘 View ExplanationQ25. Which data type does “ordinal” data represent?
📘 View ExplanationQ26. In time series, “seasonal variation” means:
📘 View ExplanationQ27. Which software is widely used for statistical analysis?
📘 View ExplanationQ28. Which method is used to estimate population parameter from sample statistics?
📘 View ExplanationQ29. Which is NOT a valid probability value?
📘 View ExplanationQ30. What is the purpose of “Bayes Theorem”?
📘 View ExplanationQ31. Sampling technique in which every element has equal chance of selection is:
📘 View ExplanationQ32. What is the mode of the data set: 1, 2, 2, 3, 4?
📘 View ExplanationQ33. What is heteroscedasticity in regression analysis?
📘 View ExplanationQ34. Which of the following is a descriptive statistic?
📘 View ExplanationQ35. Which test checks the goodness of fit?
📘 View ExplanationQ36. Which is the measure of relationship strength between two variables?
📘 View ExplanationQ37. Linear models assume:
📘 View ExplanationQ38. In statistical inference, a Type I error is:
📘 View ExplanationQ39. Which is NOT a measure of central tendency?
📘 View ExplanationQ40. Which method is used to solve simultaneous linear equations?
📘 View Explanation
NEW


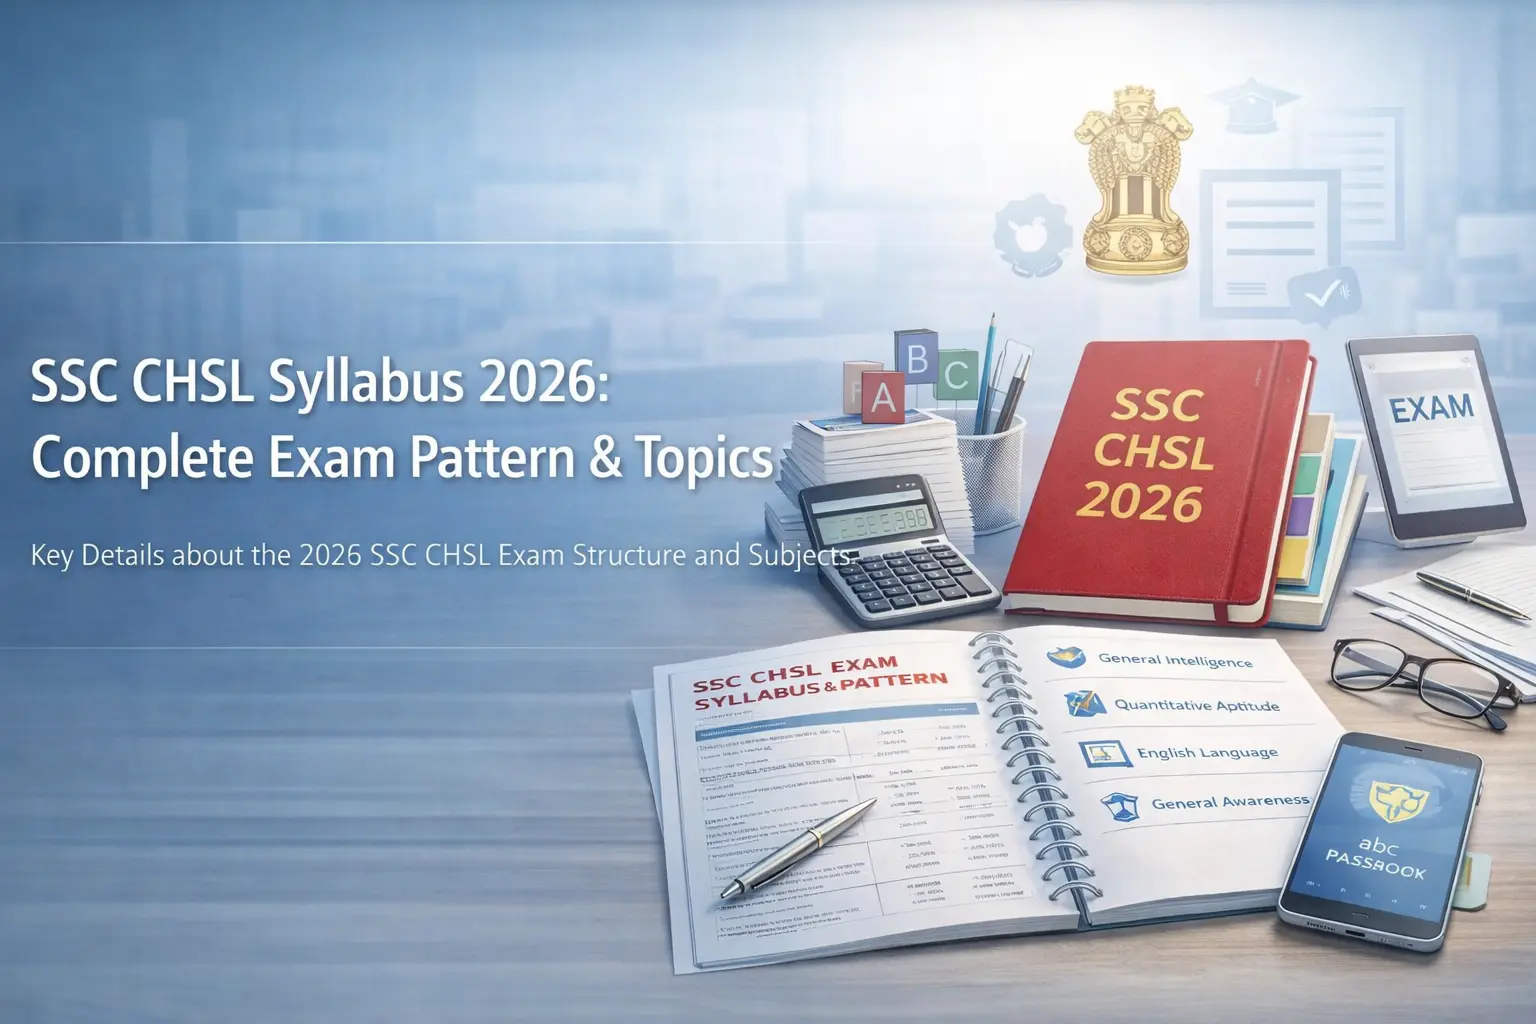
SSC CHSL Tier 1 Syllabus 2026
NEW
AngularJS Interview Questions and Answers
NEW
Difference Between HTML and XML (HTML vs XML)
NEW
CBSE 12th Result 2026 Re-Evaluation: Apply Online, Fees, Last Date & Step-by-Step Process Explained
NEW
NEET UG 2026 Re-Exam Date Announced: Check New Exam Date, Schedule & Latest Updates
NEW
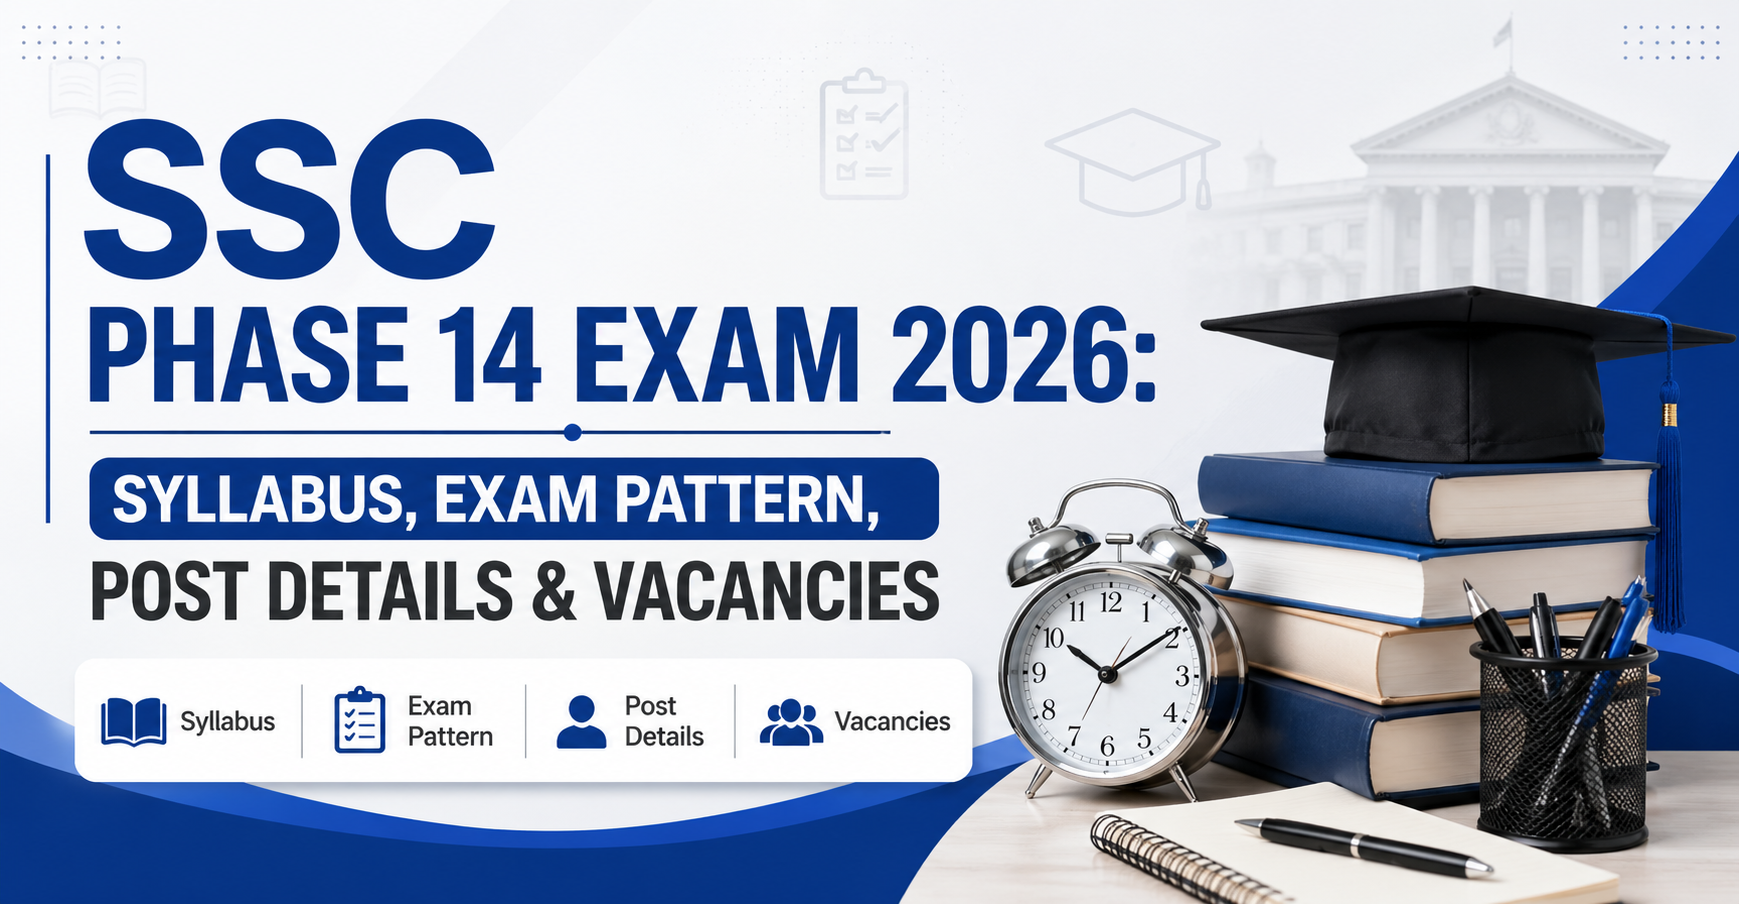
Understanding the SSC Phase 14 Exam: A Comprehensive Overview
NEW
Top Study Tips for Cracking Your Exams with Confidence
NEW
Aerospace Engineering: Scope, Courses & Career Opportunities
NEW
SSC CHSL Syllabus
NEW
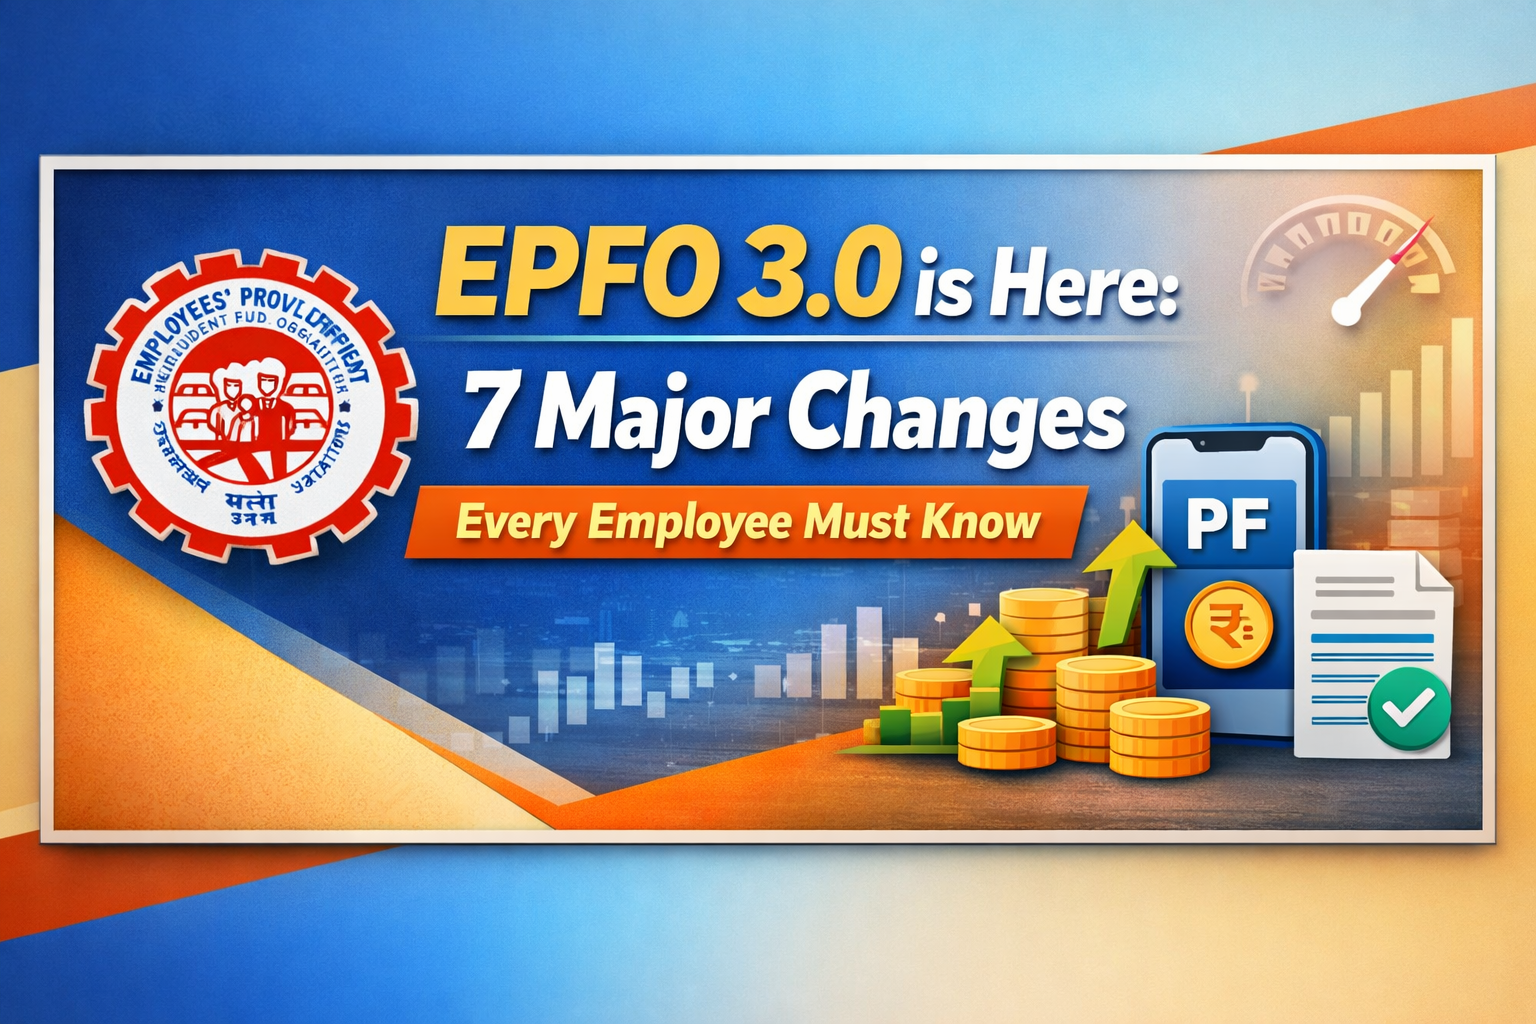
EPFO 3.0 is Here: 7 Major Changes Every Employee Must Know
NEW
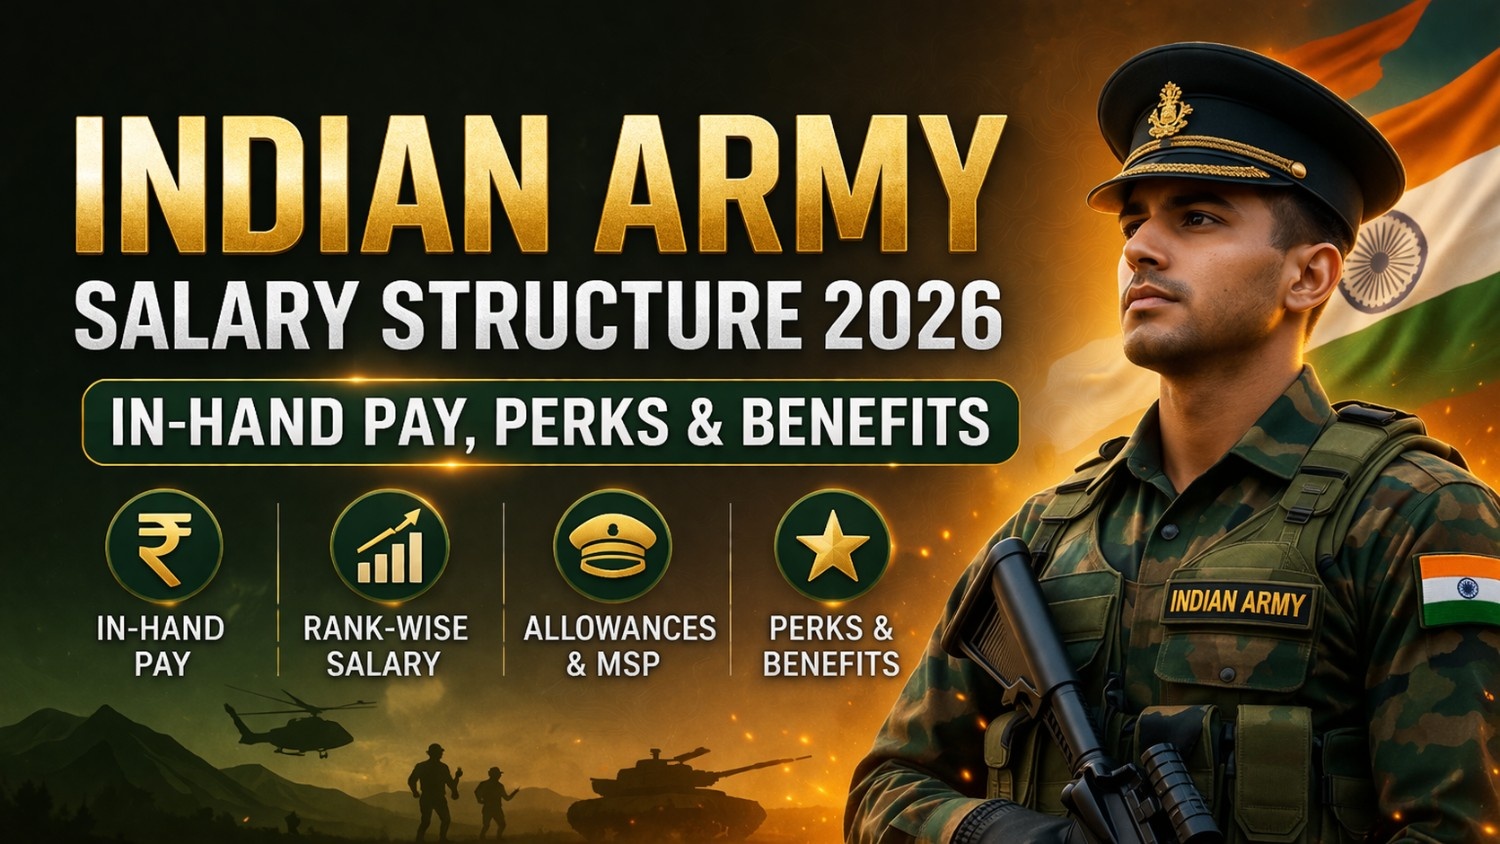
Indian Army Salary Structure
NEW